Analyzing, Graphing and Displaying Data -> histograms
Histograms: An Explanation
A histogram is a graphical representation of data that shows the frequency distribution of a set of continuous or discrete data. It consists of a series of bars that represent different intervals or categories of the data, with the height of each bar corresponding to the frequency or relative frequency of the data within that interval.
Key Components of a Histogram
- Bars: The bars on a histogram represent the intervals or categories of the data. The width of each bar may vary, but the height is proportional to the frequency of the data within that interval.
- Axis: A histogram has a horizontal axis (x-axis) that represents the intervals or categories of the data, and a vertical axis (y-axis) that represents the frequency or relative frequency of the data.
- Frequency: The frequency of a data interval is the number of data points that fall within that interval. The height of each bar in the histogram corresponds to the frequency of the data in the interval it represents.
- Title and Labels: A histogram should have a title that describes the data being represented, as well as labeled axes to indicate the scale and units of measurement.
Creating a Histogram
To create a histogram, you can follow these general steps:
- Organize the Data: Group the data into intervals or categories, and determine the frequency of data points within each interval.
- Draw the Axes: Create a horizontal axis and a vertical axis that can accommodate the range of data and frequency values.
- Draw the Bars: Draw a bar for each interval, with the height of each bar corresponding to the frequency of the data within that interval.
- Add Title and Labels: Include a title that describes the data and label the axes with appropriate scale and units of measurement.
Interpreting a Histogram
When interpreting a histogram, consider the shape, center, and spread of the data. Look for patterns, clusters, gaps, and outliers within the data distribution. Histograms are useful for identifying the distribution of the data and understanding its characteristics.
Study Guide: Understanding Histograms
As you study histograms, consider the following key points:
- Understand the purpose of a histogram and how it differs from other types of graphical representations, such as bar graphs and line graphs.
- Learn how to create a histogram from a given set of data, including organizing the data into intervals, determining frequency, and drawing the bars and axes.
- Practice interpreting histograms by analyzing the shape, center, and spread of the data, and identifying any notable features or trends within the distribution.
- Explore different types of data distributions, such as normal distributions, skewed distributions, and multimodal distributions, and how they are reflected in histograms.
- Review the use of histograms in real-world scenarios, such as in statistical analysis, quality control, and scientific research, to understand their practical applications.
By understanding the principles of histograms and practicing their creation and interpretation, you can develop a strong foundation in analyzing and visualizing data distributions.
.◂Math Worksheets and Study Guides Seventh Grade. Analyzing, Graphing and Displaying Data

 Worksheet/Answer key
 Worksheet/Answer key
 Worksheet/Answer key
 Worksheet/Answer key
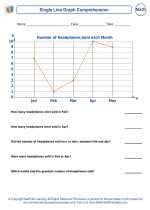
 Worksheet/Answer key
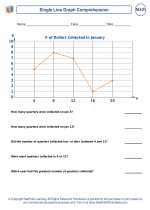
 Worksheet/Answer key