Line Chart Study Guide
A line chart, also known as a line graph, is a type of chart that displays information as a series of data points connected by straight line segments. It is commonly used to show how data changes over time or to display trends.
Key Components of a Line Chart
- X-axis: The horizontal axis that represents the independent variable (e.g., time, categories).
- Y-axis: The vertical axis that represents the dependent variable (e.g., numerical values).
- Data Points: Individual points on the chart that represent specific values of the data being displayed.
- Lines: The lines that connect the data points, showing the trend or pattern in the data.
- Title: A descriptive title that summarizes the chart's purpose or the data being presented.
- Legend: A key that explains the meaning of different lines or colors on the chart, especially useful when comparing multiple data series.
Creating a Line Chart
To create a line chart, follow these steps:
- Organize your data with the independent variable (e.g., time periods) in one column and the corresponding dependent variable values in another column.
- Select the data and insert a line chart using your preferred software (e.g., Excel, Google Sheets, or specialized charting tools).
- Choose the appropriate chart settings, including axis labels, title, and legend, to effectively communicate the data.
- Review and refine the chart to ensure clarity and accuracy.
Interpreting a Line Chart
When interpreting a line chart, consider the following:
- Look for trends or patterns in the data over time or across categories.
- Identify any significant changes or anomalies in the data.
- Compare multiple lines on the chart to understand relationships or differences between data series.
- Use the chart's title and axis labels to understand the context and meaning of the data.
Practice Questions
Test your understanding with the following practice questions:
- What are the key components of a line chart?
- How do you create a line chart?
- What should you consider when interpreting a line chart?
Conclusion
Line charts are valuable tools for visually representing and analyzing data trends. By understanding their components and interpretation, you can effectively communicate and extract insights from line chart data.
.◂Math Worksheets and Study Guides Seventh Grade. The Pythagorean Theorem
Study Guide The Pythagorean Theorem
  Study Guide
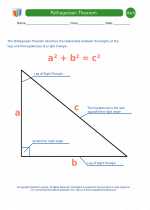 Pythagorean Theorem Definitions
  Worksheet/Answer key
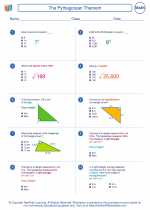 The Pythagorean Theorem
  Worksheet/Answer key
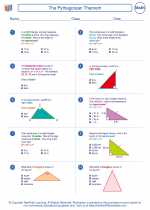 The Pythagorean Theorem
  Worksheet/Answer key
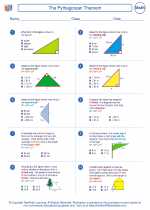 The Pythagorean Theorem
  Worksheet/Answer key
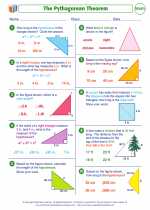 The Pythagorean Theorem
  Worksheet/Answer key
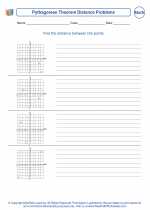 Pythagorean Theorem Distance Problems
  Worksheet/Answer key
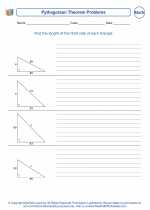 Pythagorean Theorem Problems
  Worksheet/Answer key
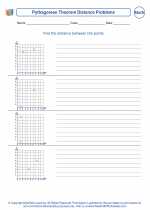 Pythagorean Theorem Distance Problems
  Worksheet/Answer key
 Pythagorean Theorem Problems
  Worksheet/Answer key
 Solving Right Triangles
  Worksheet/Answer key
 Solving Right Triangles

 Study Guide
 Worksheet/Answer key
 Worksheet/Answer key
 Worksheet/Answer key
 Worksheet/Answer key
 Worksheet/Answer key
 Worksheet/Answer key
 Worksheet/Answer key
 Worksheet/Answer key
 Worksheet/Answer key
 Worksheet/Answer key

The resources above cover the following skills:
Geometry (NCTM)
Analyze characteristics and properties of two- and three-dimensional geometric shapes and develop mathematical arguments about geometric relationships.
Create and critique inductive and deductive arguments concerning geometric ideas and relationships, such as congruence, similarity, and the Pythagorean relationship.