Time Series Analysis
Time series analysis is a statistical technique used to analyze and interpret data points collected at regular intervals over time. It is commonly used to forecast future values based on past and present trends, identify patterns and anomalies, and make informed decisions in various fields such as finance, economics, weather forecasting, and more.
Key Concepts in Time Series Analysis
- Time Series Data: Time series data consists of observations or measurements taken at successive, equally spaced time intervals. It can include daily stock prices, monthly sales figures, annual temperature records, and so on.
- Trend Analysis: Time series analysis helps to identify long-term patterns or trends in the data, such as increasing or decreasing values over time. This can be done using statistical methods like linear regression or moving averages.
- Seasonal Variation: Many time series data exhibit seasonal patterns, such as sales peaking during certain months or temperature variations across different seasons. Seasonal adjustment techniques are used to remove these patterns for a clearer analysis.
- Forecasting: Time series analysis enables forecasting future values based on historical data and identified patterns. Methods like exponential smoothing, ARIMA (AutoRegressive Integrated Moving Average), and machine learning models are commonly used for forecasting.
- Anomaly Detection: Time series analysis helps in detecting anomalies or outliers in the data, which may indicate unusual events or errors. Statistical techniques and visualization tools are used to identify and investigate these anomalies.
Tools and Techniques
Several tools and techniques are used in time series analysis, including:
- Statistical Software: Software packages like R, Python with libraries such as Pandas, NumPy, and statsmodels, and specialized time series analysis packages provide tools for data manipulation, visualization, and modeling.
- Time Series Decomposition: Decomposition techniques separate the time series data into its underlying components, including trend, seasonal variation, and random fluctuations, to analyze each component separately.
- Autocorrelation and Partial Autocorrelation: These techniques help in identifying the correlation of the time series data with its lagged values, which is essential for modeling and forecasting.
- Time Series Models: Models like ARIMA, SARIMA (Seasonal ARIMA), Exponential Smoothing, and machine learning models (e.g., LSTM, GRU) are used for analyzing and forecasting time series data.
Study Tips for Time Series Analysis
Here are some study tips to excel in time series analysis:
- Understand the Basics: Start by understanding the fundamental concepts of time series data, trend analysis, seasonal variation, and forecasting methods.
- Practice with Real Data: Work with real-world time series data to apply different techniques and gain practical insights into analyzing and interpreting the data.
- Explore Different Models: Familiarize yourself with various time series models and understand their strengths and limitations for different types of data and patterns.
- Use Software and Tools: Practice using statistical software and libraries to manipulate data, visualize trends, and build time series models.
- Stay Updated: Keep up with the latest developments in time series analysis, including new methods, research papers, and applications in different industries.
Conclusion
Time series analysis is a powerful tool for understanding and making predictions based on time-ordered data. By mastering the concepts and techniques of time series analysis, you can gain valuable insights into the behavior of data over time and make informed decisions in various domains.
.◂Math Worksheets and Study Guides Seventh Grade. The Pythagorean Theorem
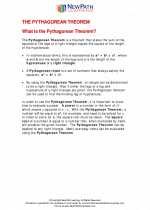
 Study Guide
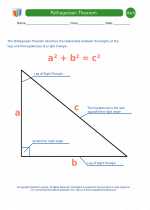
 Worksheet/Answer key
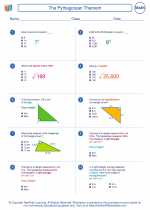
 Worksheet/Answer key
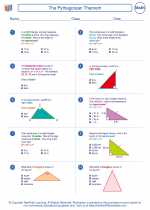
 Worksheet/Answer key
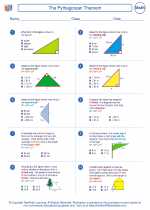
 Worksheet/Answer key
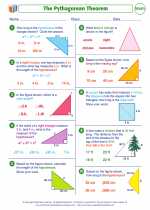
 Worksheet/Answer key
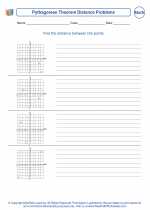
 Worksheet/Answer key
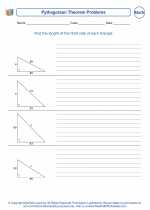
 Worksheet/Answer key
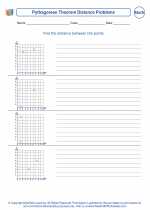
 Worksheet/Answer key
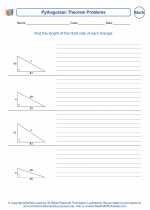
 Worksheet/Answer key
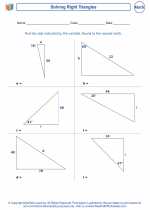
 Worksheet/Answer key