Pie Chart Study Guide
A pie chart is a circular statistical graphic that is divided into slices to illustrate numerical proportion. The arc length of each slice is proportional to the quantity it represents. It is a useful way to represent data with categories and show the proportion of each category in relation to the whole.
Key Concepts
- Sector: Each slice of the pie chart is called a sector, representing a category or data point.
- Angle: The angle of each sector is proportional to the quantity it represents, with the total angle in a pie chart always equal to 360 degrees.
- Percentage: Pie charts often display the percentage or proportion of each category relative to the whole.
- Labels: Categories or data points are typically labeled within or outside the pie chart for clarity.
Creating a Pie Chart
To create a pie chart, follow these steps:
- Collect Data: Gather the numerical data that you want to represent in the pie chart.
- Calculate Total: Find the total of all the data values to determine the whole that the pie chart will represent.
- Calculate Percentages: Calculate the percentage of each data value relative to the total.
- Determine Angles: Convert the percentages to angles (in degrees) by multiplying by 360.
- Draw the Chart: Use a protractor or graphing software to draw the sectors and label the categories.
Interpreting a Pie Chart
When interpreting a pie chart, consider the following:
- Comparisons: Compare the sizes of the sectors to understand the relative proportions of the categories.
- Trends: Identify any obvious trends or patterns in the data represented by the pie chart.
- Limitations: Be aware of the limitations of pie charts, such as difficulty in comparing multiple pie charts or accurately judging angles.
Examples
Here are some examples of pie charts:

Practice Problems
Try solving the following practice problems to test your understanding of pie charts:
- Given the following data, create a pie chart to represent the distribution of sales for a company:
- Category A: 25%
- Category B: 35%
- Category C: 20%
- Category D: 20%
- Interpret the pie chart below and identify the category that represents the largest proportion of the data:

Good luck with your pie chart studies!
[Pie Chart] Related Worksheets and Study Guides:
.◂Math Worksheets and Study Guides Eighth Grade. Real numbers
Study Guide Real numbers
  Worksheet/Answer key
 Real numbers
  Worksheet/Answer key
 Real numbers
  Worksheet/Answer key
 Real numbers
  Worksheet/Answer key
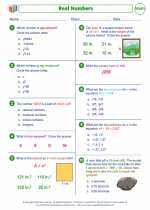 Real numbers

 Worksheet/Answer key
 Worksheet/Answer key
 Worksheet/Answer key
 Worksheet/Answer key

The resources above cover the following skills:
The Number System
Know that there are numbers that are not rational, and approximate them by rational numbers.
Know that numbers that are not rational are called irrational. Understand informally that every number has a decimal expansion; for rational numbers show that the decimal expansion repeats eventually, and convert a decimal expansion which repeats eventually into a rational number. [8-NS1]
Expressions and Equations
Work with radicals and integer exponents.
Use square root and cube root symbols to represent solutions to equations of the form x^2 = p and x^3 = p, where p is a positive rational number. Evaluate square roots of small perfect squares and cube roots of small perfect cubes. Know that √2 is irrational. [8-EE2]