Two-Way Table
A two-way table is a way of organizing and displaying data to show the relationship between two categorical variables. It is often used to summarize and compare the frequency or proportion of observations that fall into certain categories for both variables. The rows of the table represent one variable, while the columns represent the other variable. Two-way tables are commonly used in statistics to analyze and interpret data.
Example of a Two-Way Table:
Here's an example of a two-way table that shows the favorite fruit choices of students based on their gender:
| Apples | Oranges | Bananas | |
|---|---|---|---|
| Male | 20 | 15 | 10 |
| Female | 25 | 20 | 15 |
Study Guide:
- Understand the variables: Make sure you understand the two categorical variables being compared in the two-way table.
- Interpret the table: Analyze the table to understand the frequency or proportion of observations in each category for both variables.
- Calculate totals: Calculate the row and column totals to understand the overall distribution of the data.
- Identify patterns: Look for patterns or trends in the data to draw conclusions about the relationship between the two variables.
- Use percentages: Convert the frequencies to percentages to compare the relative frequencies of the categories.
Understanding how to create, interpret, and analyze a two-way table is an important skill for analyzing categorical data and making inferences about the relationship between two variables.
.◂Math Worksheets and Study Guides Eighth Grade. Three dimensional geometry/Measurement
Study Guide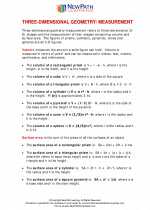 Three dimensional geometry/Measurement
  Worksheet/Answer key
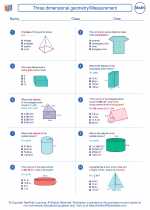 Three dimensional geometry/Measurement
  Worksheet/Answer key
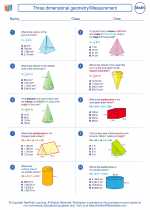 Three dimensional geometry/Measurement
  Worksheet/Answer key
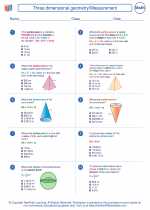 Three dimensional geometry/Measurement
  Worksheet/Answer key
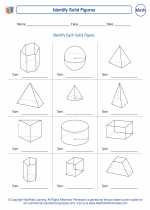 Identify Solid Figures
  Worksheet/Answer key
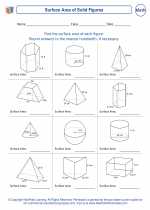 Surface Area of Solid Figures
  Worksheet/Answer key
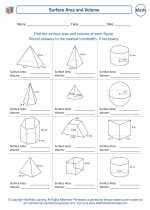 Surface Area and Volume
  Worksheet/Answer key
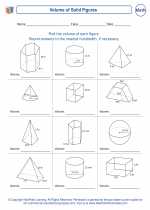 Volume of Solid Figures
  Worksheet/Answer key
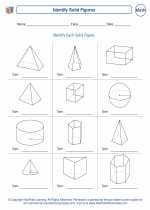 Surface Area and Volume
  Worksheet/Answer key
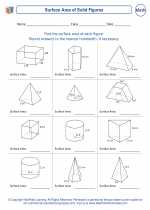 Surface Area of Solid Figures
  Worksheet/Answer key
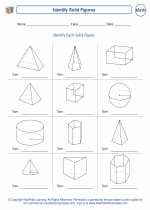 Identify Solid Figures
  Worksheet/Answer key
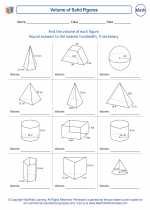 Volume of Solid Figures

 Worksheet/Answer key
 Worksheet/Answer key
 Worksheet/Answer key
 Worksheet/Answer key
 Worksheet/Answer key
 Worksheet/Answer key
 Worksheet/Answer key
 Worksheet/Answer key
 Worksheet/Answer key
 Worksheet/Answer key
 Worksheet/Answer key

The resources above cover the following skills:
Geometry (NCTM)
Analyze characteristics and properties of two- and three-dimensional geometric shapes and develop mathematical arguments about geometric relationships.
Precisely describe, classify, and understand relationships among types of two- and three-dimensional objects using their defining properties.
Use visualization, spatial reasoning, and geometric modeling to solve problems.
Use geometric models to represent and explain numerical and algebraic relationships.
Measurement (NCTM)
Apply appropriate techniques, tools, and formulas to determine measurements.
Select and apply techniques and tools to accurately find length, area, volume, and angle measures to appropriate levels of precision.
Develop strategies to determine the surface area and volume of selected prisms, pyramids, and cylinders.