Venn Diagrams Study Guide
What are Venn Diagrams?
A Venn diagram is a visual representation of the relationship between sets. It is used to show all possible logical relations between a finite collection of different sets. Venn diagrams are often used in mathematics, logic, statistics, and computer science.
Components of a Venn Diagram
A Venn diagram consists of overlapping circles or other shapes that represent different sets. Each circle represents a set, and the overlapping areas represent the elements that are common to those sets.
Key Terminology
- Universal Set: The set that contains all the elements under consideration.
- Intersection: The overlapping area of the sets, representing the elements that are common to both sets.
- Union: The entire area covered by the sets, representing all the elements in both sets, including the overlapping area.
- Complement: The elements that are in the universal set but not in a particular set.
How to Use Venn Diagrams
To create and interpret a Venn diagram, follow these steps:
- Determine the sets you want to represent and draw circles to represent each set, ensuring that the circles overlap if there are elements common to the sets.
- Place the elements of the sets in the appropriate regions of the diagram, ensuring that elements are placed in the overlapping areas if they are common to multiple sets.
- Use the diagram to find the intersection, union, and complement of the sets as needed.
Example
Let's consider a simple example of a Venn diagram with two sets, A and B:

In this example, the intersection of A and B is the overlapping area, the union of A and B is the entire shaded area, and the complement of A is the area outside of set A within the universal set.
Practice Questions
- Create a Venn diagram to represent the sets: A = {1, 2, 3, 4} and B = {3, 4, 5, 6}. Find the intersection and union of the sets.
- If the universal set contains the elements {1, 2, 3, 4, 5, 6, 7, 8, 9, 10}, find the complement of set A.
Remember, the key to understanding Venn diagrams is to practice creating and interpreting them with different sets. Good luck!
.◂Math Worksheets and Study Guides Eighth Grade. Three dimensional geometry/Measurement
 Worksheet/Answer key
 Worksheet/Answer key
 Worksheet/Answer key
 Worksheet/Answer key
 Worksheet/Answer key
 Worksheet/Answer key
 Worksheet/Answer key
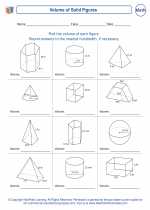
 Worksheet/Answer key
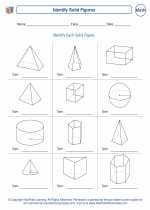
 Worksheet/Answer key
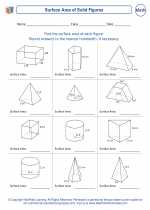
 Worksheet/Answer key
 Worksheet/Answer key