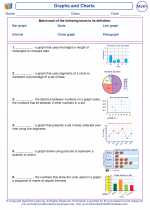
Graphs and Charts -> bar graph
Bar Graph
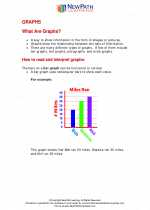
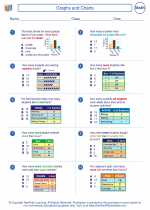
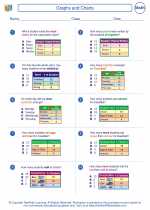
A bar graph is a type of chart that uses rectangular bars to represent different categories of data. The length of each bar is proportional to the value it represents. Bar graphs are used to compare different groups or to track changes over time.
Parts of a Bar Graph
1. Title: The title of the bar graph describes the information being displayed.
2. X-Axis: The horizontal axis of the graph represents the categories or groups being compared.
3. Y-Axis: The vertical axis of the graph represents the scale or values being measured.
4. Bars: The rectangular bars represent the data for each category. The height or length of the bar corresponds to the value it represents.
Creating a Bar Graph
To create a bar graph, follow these steps:
- Choose the categories or groups to be represented on the x-axis.
- Determine the scale or values to be represented on the y-axis.
- Draw and label the axes, including the scale for the y-axis.
- Create bars for each category, making sure the height or length of each bar corresponds to the value it represents.
- Add a title to the graph.
- Label each axis and the bars as needed.
Interpreting a Bar Graph
When interpreting a bar graph, consider the following:
- Look at the height or length of each bar to compare the values of different categories.
- Check the scale of the y-axis to understand the range of values being represented.
- Examine the title and axis labels to understand the context of the data being displayed.
Bar graphs are a useful tool for visually representing and comparing data in a clear and effective manner.
.◂Math Worksheets and Study Guides Third Grade. Graphs and Charts
 Activity Lesson
 Activity Lesson
 Activity Lesson
 Worksheet/Answer key
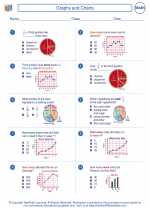
 Worksheet/Answer key
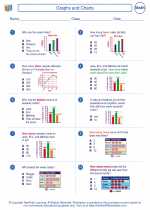
 Worksheet/Answer key
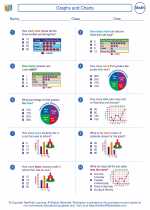
 Worksheet/Answer key
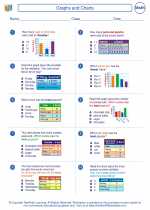
 Worksheet/Answer key
 Worksheet/Answer key
 Worksheet/Answer key
 Worksheet/Answer key
 Worksheet/Answer key
 Worksheet/Answer key
 Vocabulary/Answer key