Graphs -> line graph
Line Graphs
A line graph is a type of chart used to display data. It is particularly useful for showing trends and changes over time.
Components of a Line Graph
- X-axis: The horizontal axis that represents the independent variable, usually time or another continuous variable.
- Y-axis: The vertical axis that represents the dependent variable, typically the quantity being measured or observed.
- Line: A line that connects data points to show the relationship between the variables.
- Data points: Individual points plotted on the graph representing specific values of the variables.
Creating a Line Graph
To create a line graph, follow these steps:
- Identify the variables to be plotted on the graph.
- Select a suitable scale for the axes.
- Plot the data points on the graph.
- Connect the points with a line to show the trend or pattern.
Interpreting a Line Graph
When interpreting a line graph, consider the following:
- Look for trends, patterns, or relationships between the variables.
- Check the scale of the axes to understand the magnitude of the data.
- Identify any significant changes or anomalies in the data.
Example
Suppose we want to plot the temperature over a week. Here's how the data might look:
| Day | Temperature (°C) |
|---|---|
| Monday | 18 |
| Tuesday | 20 |
| Wednesday | 22 |
| Thursday | 25 |
| Friday | 23 |
| Saturday | 19 |
| Sunday | 17 |
Using this data, we can create a line graph to visualize the temperature changes over the week.
Review Questions
.◂Math Worksheets and Study Guides Sixth Grade. Graphs
Study Guide Graphs
  Activity Lesson
 Venn Diagrams
  Worksheet/Answer key
 Graphs
  Worksheet/Answer key
 Graphs
  Worksheet/Answer key
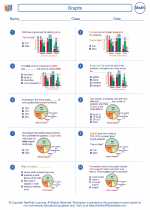 Graphs
  Worksheet/Answer key
 Graphs
  Worksheet/Answer key
 Graphs
  Worksheet/Answer key
 Graphs
  Worksheet/Answer key
 Single Line Graph
  Worksheet/Answer key
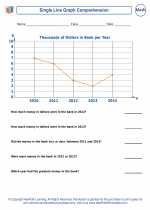 Single Line Graph Comprehension
  Worksheet/Answer key
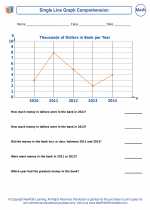 Single Line Graph Comprehension
  Worksheet/Answer key
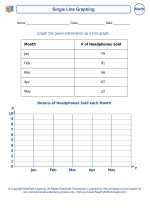 Single Line Graph
  Worksheet/Answer key
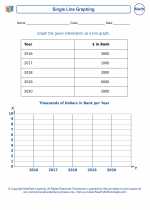 Single Line Graph
  Worksheet/Answer key
 Single Line Graph
  Worksheet/Answer key
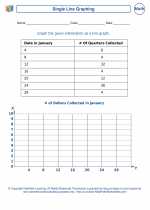 Single Line Graph
  Worksheet/Answer key
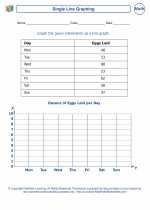 Single Line Graph
  Worksheet/Answer key
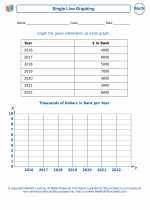 Single Line Graph

 Activity Lesson
 Worksheet/Answer key
 Worksheet/Answer key
 Worksheet/Answer key
 Worksheet/Answer key
 Worksheet/Answer key
 Worksheet/Answer key
 Worksheet/Answer key
 Worksheet/Answer key
 Worksheet/Answer key
 Worksheet/Answer key
 Worksheet/Answer key
 Worksheet/Answer key
 Worksheet/Answer key
 Worksheet/Answer key
 Worksheet/Answer key

The resources above cover the following skills:
Data Analysis and Probability (NCTM)
Formulate questions that can be addressed with data and collect, organize, and display relevant data to answer them.
Select, create, and use appropriate graphical representations of data, including histograms, box plots, and scatterplots.
Select and use appropriate statistical methods to analyze data.
Discuss and understand the correspondence between data sets and their graphical representations, especially histograms, stem-and-leaf plots, box plots, and scatterplots.