Diagrams
Diagrams are visual representations of information and data. They are used to organize and present information in a way that is easy to understand. There are different types of diagrams, each serving a specific purpose. Understanding how to read and interpret diagrams is an important skill in math and other subjects.
Types of Diagrams:
- Bar Graphs: Used to compare different categories of data.
- Line Graphs: Show the relationship between two variables over time or other continuous intervals.
- Pie Charts: Display the parts of a whole and show the proportion of each category.
- Scatter Plots: Show the relationship between two sets of data.
- Tables: Organize data into rows and columns for easy comparison.
- Flowcharts: Illustrate the steps in a process or algorithm.
- Venn Diagrams: Show the relationships between different sets of data.
How to Read and Interpret Diagrams:
When reading and interpreting diagrams, it's important to pay attention to the following:
- The title of the diagram, which provides information about what the diagram is representing.
- The labels on the axes or categories, which indicate what is being measured or compared.
- The scale or increments, which show the units of measurement and help in understanding the magnitude of the data.
- The key or legend, which explains the meaning of different colors or symbols used in the diagram.
- The trends or patterns in the data, which can be used to make inferences and draw conclusions.
Study Guide:
To study diagrams effectively, consider the following tips:
- Practice interpreting different types of diagrams, such as bar graphs, line graphs, and pie charts.
- Understand the purpose of each type of diagram and when it is best used to represent data.
- Learn how to create your own diagrams using data sets and appropriate software or tools.
- Work on problem-solving exercises that involve analyzing and interpreting diagrams to answer questions.
- Review real-world examples of diagrams used in various fields, such as business, science, and social studies.
By mastering the skill of reading and interpreting diagrams, you will be better equipped to understand and analyze data in different contexts.
[Diagrams] Related Worksheets and Study Guides:
.◂Math Worksheets and Study Guides Sixth Grade. Mixed Numbers
Study Guide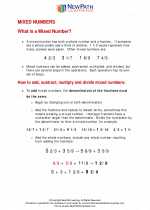 Mixed Numbers
  Worksheet/Answer key
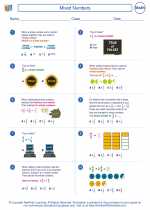 Mixed Numbers
  Worksheet/Answer key
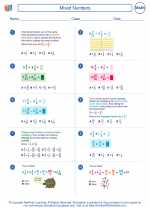 Mixed Numbers
  Worksheet/Answer key
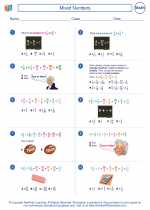 Mixed Numbers
  Worksheet/Answer key
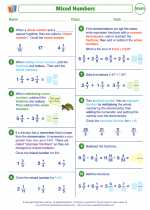 Mixed Numbers

 Worksheet/Answer key
 Worksheet/Answer key
 Worksheet/Answer key
 Worksheet/Answer key

The resources above cover the following skills:
Number and Operations (NCTM)
Compute fluently and make reasonable estimates.
Develop and analyze algorithms for computing with fractions, decimals, and integers and develop fluency in their use.