Histograms
Definition:
A histogram is a graphical representation of the distribution of numerical data. It consists of a series of contiguous, non-overlapping rectangles, each of which represents a class interval and the area of each rectangle is proportional to the frequency of the class it represents.
Key Components:
- Class Intervals: The range of values that data is grouped into.
- Frequencies: The number of data points within each class interval.
- Bars: The rectangles representing each class interval, with the height of the bar corresponding to the frequency of that interval.
- Axis: The horizontal x-axis represents the class intervals, while the vertical y-axis represents the frequencies.
Creating a Histogram:
- Collect Data: Gather the numerical data that you want to represent in the histogram.
- Choose Class Intervals: Divide the range of data into equal-sized intervals.
- Count Frequencies: Count how many data points fall into each class interval.
- Draw Bars: Draw a bar for each class interval, with the height of the bar corresponding to the frequency.
- Add Axis Labels: Label the x-axis with the class intervals and the y-axis with the frequencies.
Interpreting a Histogram:
When interpreting a histogram, you can analyze the shape, center, and spread of the data. A symmetrical distribution will have a similar number of data points on either side of the center, while a skewed distribution will have a longer tail on one side. The spread of the data can be inferred from the width of the bars and how the data is distributed across the class intervals.
Study Guide:
Here are some key points to remember when working with histograms:
- Understand the concept of class intervals and frequencies.
- Learn to create a histogram from given data.
- Practice interpreting histograms to understand the distribution of data.
- Recognize the different shapes and patterns that can appear in histograms.
- Use histograms to compare different data sets and identify trends.
With this understanding and practice, you'll be able to effectively work with histograms and gain insights into the distribution of numerical data.
[Histograms] Related Worksheets and Study Guides:
.◂Math Worksheets and Study Guides Eighth Grade. Three dimensional geometry/Measurement
 Worksheet/Answer key
 Worksheet/Answer key
 Worksheet/Answer key
 Worksheet/Answer key
 Worksheet/Answer key
 Worksheet/Answer key
 Worksheet/Answer key
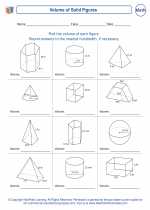
 Worksheet/Answer key
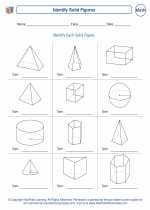
 Worksheet/Answer key
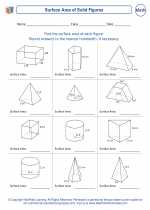
 Worksheet/Answer key
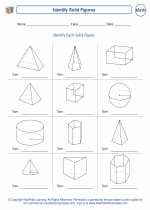
 Worksheet/Answer key