New Printable Worksheets and Lesson Activities. Page 2
English Language Arts
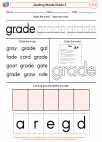
Why is Spelling Important? It is important to spell words correctly when writing. There are some words that are difficult to learn and to remember how to spell correctly. Homonyms, plurals, and possessive words are often difficult to
remember how to spell correctly.
Worksheet Spelling WordsGrade 3
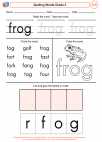
Why is Spelling Important? It is important to spell words correctly when writing. There are some words that are difficult to learn and to remember how to spell correctly. Homonyms, plurals, and possessive words are often difficult to
remember how to spell correctly.
Worksheet Spelling WordsGrade 3
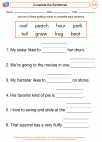
Use grammar concepts and skills that strengthen oral and written language
Distinguish between complete and incomplete sentences
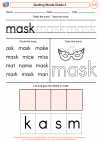
Why is Spelling Important? It is important to spell words correctly when writing. There are some words that are difficult to learn and to remember how to spell correctly. Homonyms, plurals, and possessive words are often difficult to
remember how to spell correctly.
Worksheet Spelling WordsGrade 3
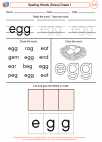
Conventions of Standard English
Demonstrate command of the conventions of Standard English capitalization, punctuation, and spelling when writing.
Use conventional spelling for words with common spelling patterns and for frequently occurring irregular words.
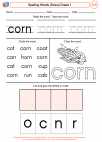
Conventions of Standard English
Demonstrate command of the conventions of Standard English capitalization, punctuation, and spelling when writing.
Use conventional spelling for words with common spelling patterns and for frequently occurring irregular words.
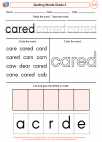
Why is Spelling Important? It is important to spell words correctly when writing. There are some words that are difficult to learn and to remember how to spell correctly. Homonyms, plurals, and possessive words are often difficult to
remember how to spell correctly.
Worksheet Spelling WordsGrade 3
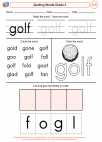
Why is Spelling Important? It is important to spell words correctly when writing. There are some words that are difficult to learn and to remember how to spell correctly. Homonyms, plurals, and possessive words are often difficult to
remember how to spell correctly.
Worksheet Spelling WordsGrade 3
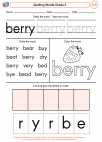
Why is Spelling Important? It is important to spell words correctly when writing. There are some words that are difficult to learn and to remember how to spell correctly. Homonyms, plurals, and possessive words are often difficult to
remember how to spell correctly.
Worksheet Spelling WordsGrade 3
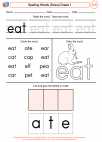
Conventions of Standard English
Demonstrate command of the conventions of Standard English capitalization, punctuation, and spelling when writing.
Use conventional spelling for words with common spelling patterns and for frequently occurring irregular words.
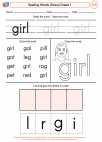
Conventions of Standard English
Demonstrate command of the conventions of Standard English capitalization, punctuation, and spelling when writing.
Use conventional spelling for words with common spelling patterns and for frequently occurring irregular words.
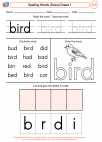
Conventions of Standard English
Demonstrate command of the conventions of Standard English capitalization, punctuation, and spelling when writing.
Use conventional spelling for words with common spelling patterns and for frequently occurring irregular words.
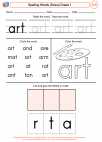
Conventions of Standard English
Demonstrate command of the conventions of Standard English capitalization, punctuation, and spelling when writing.
Use conventional spelling for words with common spelling patterns and for frequently occurring irregular words.
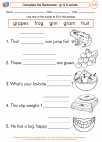
Use grammar concepts and skills that strengthen oral and written language
Distinguish between complete and incomplete sentences
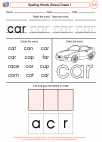
Conventions of Standard English
Demonstrate command of the conventions of Standard English capitalization, punctuation, and spelling when writing.
Use conventional spelling for words with common spelling patterns and for frequently occurring irregular words.
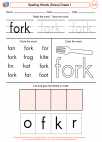
Conventions of Standard English
Demonstrate command of the conventions of Standard English capitalization, punctuation, and spelling when writing.
Use conventional spelling for words with common spelling patterns and for frequently occurring irregular words.
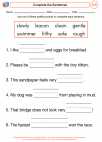
Use grammar concepts and skills that strengthen oral and written language
Distinguish between complete and incomplete sentences
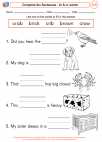
Use grammar concepts and skills that strengthen oral and written language
Distinguish between complete and incomplete sentences
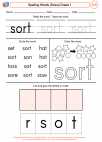
Conventions of Standard English
Demonstrate command of the conventions of Standard English capitalization, punctuation, and spelling when writing.
Use conventional spelling for words with common spelling patterns and for frequently occurring irregular words.
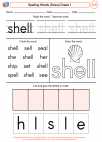
Conventions of Standard English
Demonstrate command of the conventions of Standard English capitalization, punctuation, and spelling when writing.
Use conventional spelling for words with common spelling patterns and for frequently occurring irregular words.