Charts
Charts are visual representations of data. They are used to present information in a way that is easy to understand and analyze. There are several types of charts, each suited for different types of data and analysis.
Types of Charts:
- Bar Chart: A bar chart uses bars of different lengths to represent and compare different categories of data. It is useful for comparing values across categories.
- Line Chart: A line chart uses lines to show the trend of data over time. It is useful for showing trends and changes in data over a period of time.
- Pie Chart: A pie chart uses slices of a circle to represent the parts of a whole. It is useful for showing the proportions of different parts of a whole.
- Scatter Plot: A scatter plot uses points to represent the relationship between two sets of data. It is useful for showing the relationship and correlation between two variables.
- Area Chart: An area chart is similar to a line chart, but the area below the line is filled with color. It is useful for showing the magnitude of change over time for multiple variables.
How to Read a Chart:
When reading a chart, it is important to understand the following:
- Title: The title of the chart provides information about what the chart is representing.
- Axes: The x-axis and y-axis provide the labels and scales for the data being represented.
- Legend: The legend explains the meaning of different colors or patterns used in the chart.
- Data Points: The data points on the chart represent the actual values being compared or analyzed.
How to Create a Chart:
To create a chart, follow these steps:
- Collect and organize the data that you want to represent in the chart.
- Choose the most appropriate type of chart for your data and analysis.
- Label the axes and data points clearly.
- Use colors and patterns to differentiate between different categories or data series.
- Add a title and legend to provide context and explanation for the chart.
Practice Questions:
- What type of chart would be best for comparing the sales of different products in a store?
- Explain the difference between a bar chart and a line chart.
- When would you use a pie chart instead of a bar chart?
[Charts] Related Worksheets and Study Guides:
.◂Math Worksheets and Study Guides Third Grade. Graphs and Charts
Study Guide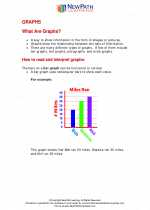 Graphs and Charts
  Activity Lesson
 Wheel Problems
  Activity Lesson
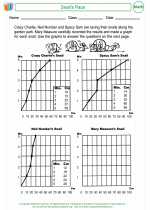 Snail's Pace
  Activity Lesson
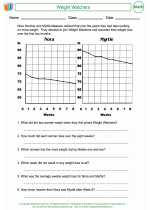 Weight Watchers
  Worksheet/Answer key
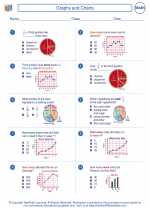 Graphs and Charts
  Worksheet/Answer key
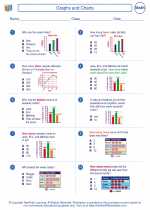 Graphs and Charts
  Worksheet/Answer key
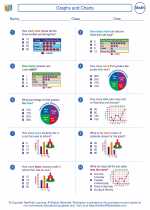 Graphs and Charts
  Worksheet/Answer key
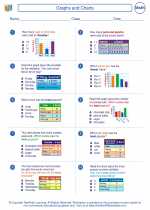 Graphs and Charts
  Worksheet/Answer key
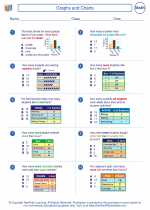 Graphs and Charts
  Worksheet/Answer key
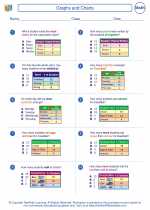 Graphs and Charts
  Worksheet/Answer key
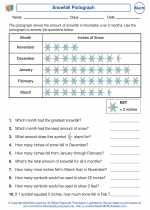 Snowfall Pictograph
  Worksheet/Answer key
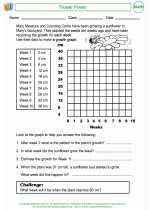 Flower Power
  Worksheet/Answer key
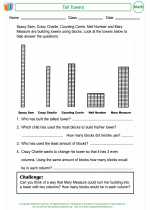 Tall Towers
  Worksheet/Answer key
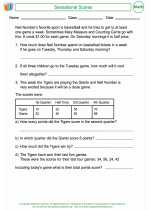 Sensational Scores
  Vocabulary/Answer key
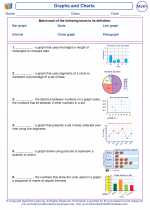 Graphs and Charts

 Activity Lesson
 Activity Lesson
 Activity Lesson
 Worksheet/Answer key
 Worksheet/Answer key
 Worksheet/Answer key
 Worksheet/Answer key
 Worksheet/Answer key
 Worksheet/Answer key
 Worksheet/Answer key
 Worksheet/Answer key
 Worksheet/Answer key
 Worksheet/Answer key
 Vocabulary/Answer key

The resources above cover the following skills:
Connections to the Grade 3 Focal Points (NCTM)
Data Analysis: Addition, subtraction, multiplication, and division of whole numbers come into play as students construct and analyze frequency tables, bar graphs, picture graphs, and line plots and use them to solve problems.