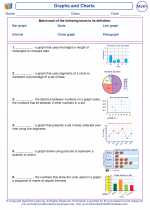
Graphs
A graph is a visual representation of data that shows the relationship between different sets of information. There are several types of graphs, each suited to represent different kinds of data.
Types of Graphs
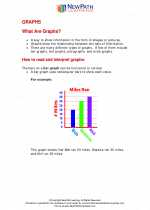
1. Bar Graphs: These are used to compare different categories of data. The height of each bar represents the frequency or amount of data in each category.
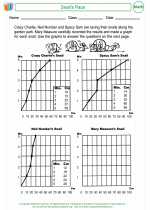
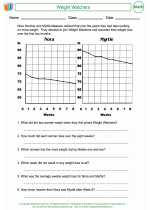
2. Line Graphs: These are used to show how data changes over time. The x-axis represents time, while the y-axis represents the value of the data at each time point.
3. Pie Charts: These are circular graphs that are divided into sections to represent the proportion of each category in a whole set of data.
4. Pictographs: These use pictures or symbols to represent data. Each picture or symbol might represent one unit or a specific quantity of the data being presented.
Key Concepts
1. Axes: Graphs have two axes - the horizontal x-axis and the vertical y-axis. The intersection of these axes is called the origin.
2. Units: Each axis is divided into units, which represent the scale of the graph. The units can be different for each axis, depending on the range of the data being represented.
3. Title: A graph should have a title that summarizes what the graph is about. It should be clear and descriptive.
4. Labels: Each axis should have a label indicating what the data represents. For example, the x-axis might represent time, while the y-axis represents quantity or frequency.
Study Guide
When studying graphs, it's important to understand the following:
1. How to read and interpret different types of graphs
2. How to create and label a graph accurately
3. How to choose the most appropriate type of graph for a given set of data
4. How to analyze the information presented in a graph and draw conclusions based on the data
5. How to use graphs to compare and contrast different sets of data
6. Understanding the importance of titles, axes, and labels in a graph
Practice drawing and interpreting different types of graphs, and make sure to understand the specific information each type of graph can convey. This will help you become proficient in using graphs to represent and analyze data.
By mastering the concepts and types of graphs, you'll be able to effectively communicate and understand data in a visual and engaging way.
[Graphs] Related Worksheets and Study Guides:
.◂Math Worksheets and Study Guides Third Grade. Graphs and Charts
 Activity Lesson
 Activity Lesson
 Activity Lesson
 Worksheet/Answer key
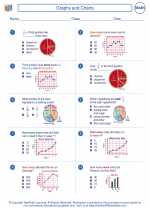
 Worksheet/Answer key
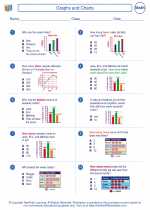
 Worksheet/Answer key
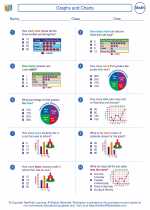
 Worksheet/Answer key
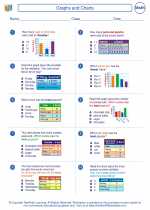
 Worksheet/Answer key
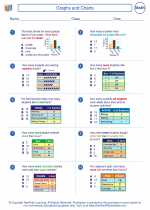
 Worksheet/Answer key
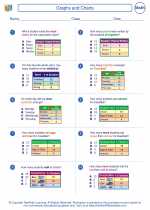
 Worksheet/Answer key
 Worksheet/Answer key
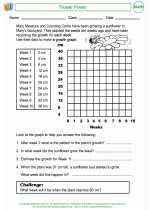
 Worksheet/Answer key
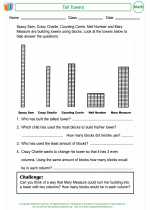
 Worksheet/Answer key
 Vocabulary/Answer key