Representation in Mathematics
Representation in mathematics refers to the ways in which mathematical concepts, quantities, and relationships can be depicted or described. There are various forms of representation in mathematics, including numerical, algebraic, geometric, and verbal representations. Each form of representation provides a different perspective on the mathematical concept being studied.Numerical Representation
Numerical representation involves using numbers to represent quantities or values. This can include whole numbers, fractions, decimals, and percentages. For example, the numerical representation of the fraction 1/2 can be expressed as the decimal 0.5 or the percentage 50%.Algebraic Representation
Algebraic representation involves using symbols and variables to represent mathematical relationships. Equations and expressions are common forms of algebraic representation. For example, the algebraic representation of the relationship "twice a number increased by 5 is equal to 15" can be represented as 2x + 5 = 15, where x represents the unknown number.Geometric Representation
Geometric representation involves using shapes, figures, and diagrams to illustrate mathematical concepts. This can include geometric shapes such as circles, triangles, and rectangles, as well as coordinate grids and graphs. For example, the geometric representation of the equation y = 2x + 3 can be shown as a line on a coordinate plane.Verbal Representation
Verbal representation involves describing mathematical concepts and relationships using words. This can include word problems, mathematical explanations, and written descriptions of mathematical processes. For example, a verbal representation of the equation 3x - 7 = 5 could be "Three times a number decreased by 7 is equal to 5."Study Guide
To effectively study the topic of representation in mathematics, consider the following tips:- Understand the different forms of representation: Familiarize yourself with numerical, algebraic, geometric, and verbal representations, and practice converting between them.
- Practice translating between representations: Work on problems that involve translating a mathematical concept from one form of representation to another, such as converting a verbal description into an algebraic equation.
- Use visual aids: Utilize visual representations such as diagrams, graphs, and geometric figures to reinforce your understanding of mathematical concepts.
- Solve word problems: Practice solving word problems that require interpreting verbal representations and translating them into mathematical expressions or equations.
- Review examples: Study examples of different forms of representation in mathematics, and identify the key components and relationships within each representation.
[Representation] Related Worksheets and Study Guides:
.◂Math Worksheets and Study Guides Sixth Grade. Graphs
Study Guide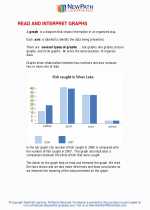 Graphs
  Activity Lesson
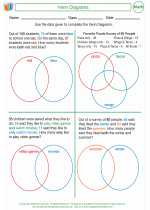 Venn Diagrams
  Worksheet/Answer key
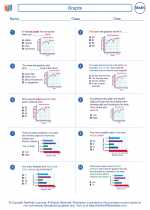 Graphs
  Worksheet/Answer key
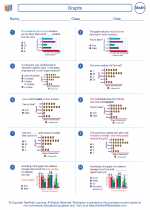 Graphs
  Worksheet/Answer key
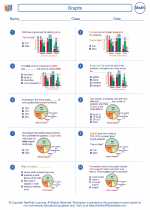 Graphs
  Worksheet/Answer key
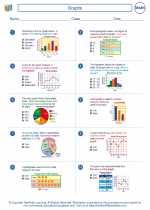 Graphs
  Worksheet/Answer key
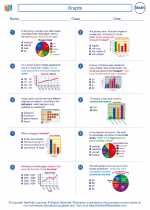 Graphs
  Worksheet/Answer key
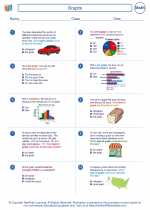 Graphs
  Worksheet/Answer key
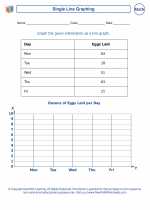 Single Line Graph
  Worksheet/Answer key
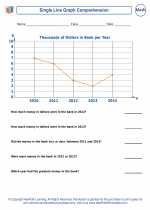 Single Line Graph Comprehension
  Worksheet/Answer key
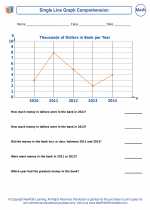 Single Line Graph Comprehension
  Worksheet/Answer key
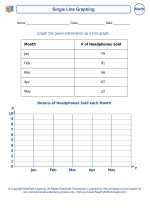 Single Line Graph
  Worksheet/Answer key
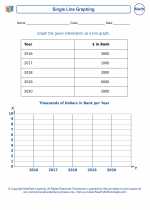 Single Line Graph
  Worksheet/Answer key
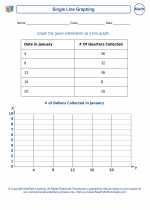 Single Line Graph
  Worksheet/Answer key
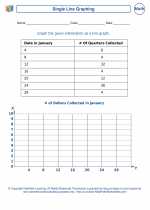 Single Line Graph
  Worksheet/Answer key
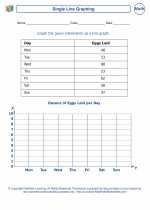 Single Line Graph
  Worksheet/Answer key
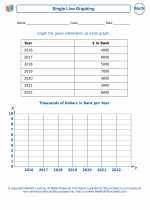 Single Line Graph

 Activity Lesson
 Worksheet/Answer key
 Worksheet/Answer key
 Worksheet/Answer key
 Worksheet/Answer key
 Worksheet/Answer key
 Worksheet/Answer key
 Worksheet/Answer key
 Worksheet/Answer key
 Worksheet/Answer key
 Worksheet/Answer key
 Worksheet/Answer key
 Worksheet/Answer key
 Worksheet/Answer key
 Worksheet/Answer key
 Worksheet/Answer key

The resources above cover the following skills:
Data Analysis and Probability (NCTM)
Formulate questions that can be addressed with data and collect, organize, and display relevant data to answer them.
Select, create, and use appropriate graphical representations of data, including histograms, box plots, and scatterplots.
Select and use appropriate statistical methods to analyze data.
Discuss and understand the correspondence between data sets and their graphical representations, especially histograms, stem-and-leaf plots, box plots, and scatterplots.