Graphical Representation of Data
Graphical representation of data involves presenting information in the form of visual elements such as charts, graphs, and tables. It helps to make complex data more understandable and easier to interpret.
Types of Graphical Representation
- Bar Graphs: Used to compare different categories of data.
- Pie Charts: Show the proportion of different parts of a whole.
- Line Graphs: Demonstrate changes in data over time.
- Scatter Plots: Display the relationship between two variables.
- Histograms: Present the distribution of numerical data.
Advantages of Graphical Representation
- Clear visualization of data.
- Easy comparison of different categories.
- Effective communication of trends and patterns.
- Identification of outliers and anomalies.
Study Guide
To effectively understand graphical representation of data, follow these steps:
- Understand the types of graphs and their uses.
- Learn to interpret different graphical representations.
- Practice creating graphs from given data sets.
- Compare and contrast different types of graphs to understand when to use each one.
- Identify real-life examples where graphical representations are used.
By mastering graphical representation of data, you'll be able to effectively communicate and analyze information in a visual format.
[Graphical Representation Of Data] Related Worksheets and Study Guides:
.◂Math Worksheets and Study Guides Sixth Grade. Statistics
Study Guide Statistics
  Worksheet/Answer key
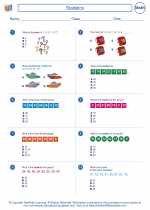 Statistics
  Worksheet/Answer key
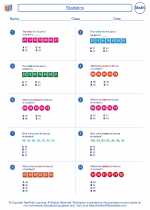 Statistics
  Worksheet/Answer key
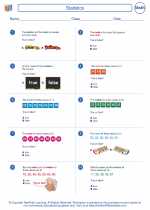 Statistics
  Worksheet/Answer key
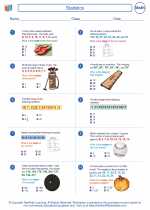 Statistics
  Worksheet/Answer key
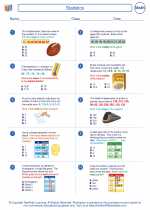 Statistics
  Worksheet/Answer key
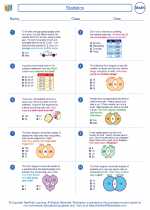 Statistics

 Worksheet/Answer key
 Worksheet/Answer key
 Worksheet/Answer key
 Worksheet/Answer key
 Worksheet/Answer key
 Worksheet/Answer key

The resources above cover the following skills:
Data Analysis and Probability (NCTM)
Select and use appropriate statistical methods to analyze data.
Find, use, and interpret measures of center and spread, including mean and interquartile range.