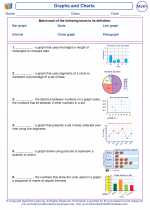
Graphs and Charts -> histograms
Histograms
A histogram is a type of bar graph that represents the frequency distribution of a continuous data set. It is used to display the distribution of data over a continuous interval or a certain period of time. Histograms are often used to visualize the frequency or probability of different ranges of values within a data set.
To create a histogram, the range of values in the data set is divided into intervals called "bins." The frequency or count of data points falling within each bin is then represented by the height of the corresponding bar.
Here's how you can create a histogram:
- Start by determining the range of values in your data set.
- Divide the range of values into equal-sized intervals or bins.
- Count the number of data points that fall into each bin.
- Draw a bar for each bin, where the height of the bar represents the frequency of data points in that bin.
Histograms are useful for identifying the central tendency, variability, and shape of a data distribution. They can also be used to detect any outliers or unusual patterns within the data set.
When interpreting a histogram, it's important to consider the width of the bins, as well as the scale of the vertical axis, to accurately represent the distribution of the data.
Overall, histograms are a powerful tool for visualizing the distribution of continuous data and gaining insights into the underlying patterns and characteristics of the data set.
[Histograms] Related Worksheets and Study Guides:
.◂Math Worksheets and Study Guides Third Grade. Graphs and Charts
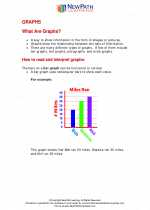
 Activity Lesson
 Activity Lesson
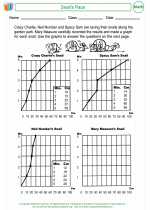
 Activity Lesson
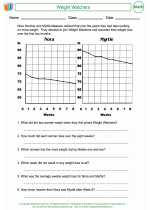
 Worksheet/Answer key
 Worksheet/Answer key
 Worksheet/Answer key
 Worksheet/Answer key
 Worksheet/Answer key
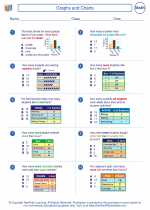
 Worksheet/Answer key
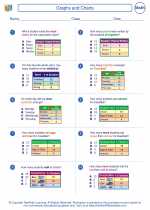
 Worksheet/Answer key
 Worksheet/Answer key
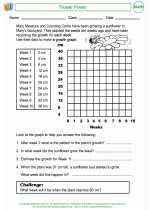
 Worksheet/Answer key
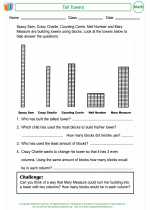
 Worksheet/Answer key
 Vocabulary/Answer key