Pie Chart Study Guide
What is a Pie Chart?
A pie chart is a circular statistical graphic that is divided into slices to illustrate numerical proportions. The size of each slice of the pie is proportional to the quantity it represents.
Parts of a Pie Chart
The key parts of a pie chart include:
- Slices: Each slice represents a category or a proportion of a whole.
- Title: A title that describes the overall data being represented.
- Labels: Labels for each slice, often showing the category or the percentage it represents.
- Legend: A key that explains what each slice represents.
How to Create a Pie Chart
To create a pie chart, follow these steps:
- Collect Data: Gather the numerical data that you want to represent in the pie chart.
- Calculate Percentages: Calculate the percentage of each category by dividing the value of each category by the total and multiplying by 100.
- Draw the Chart: Use a protractor or a circle template to draw a circle. Divide the circle into slices according to the percentage values you calculated.
- Add Labels and Legend: Label each slice with the category it represents and create a legend to explain the categories.
Interpreting a Pie Chart
When interpreting a pie chart, keep the following in mind:
- Proportions: The size of each slice shows the proportion of the whole that it represents.
- Comparison: Compare the sizes of the slices to understand the relative importance of each category.
- Percentage: Use the percentage values or labels to understand the exact proportion that each category represents.
Example:
Suppose you have data on the favorite fruits of a group of people: 30% apples, 25% bananas, 20% oranges, and 25% strawberries. You can represent this data using a pie chart, with each slice representing the percentage of people who chose each fruit as their favorite.
Conclusion
Pie charts are a useful tool for representing numerical proportions visually. They allow for easy comparison of different categories and provide a clear visualization of how a whole is divided into its parts.
Remember to use pie charts when you want to represent data as parts of a whole and when you want to easily compare proportions between different categories.
[Pie Chart] Related Worksheets and Study Guides:
.◂Math Worksheets and Study Guides Sixth Grade. Graphs
 Activity Lesson
 Worksheet/Answer key
 Worksheet/Answer key
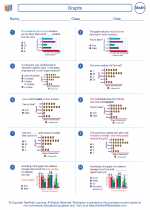
 Worksheet/Answer key
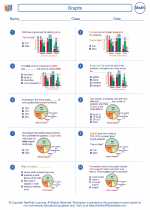
 Worksheet/Answer key
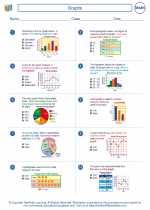
 Worksheet/Answer key
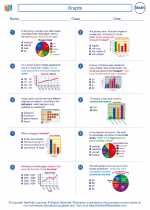
 Worksheet/Answer key
 Worksheet/Answer key
 Worksheet/Answer key
 Worksheet/Answer key
 Worksheet/Answer key
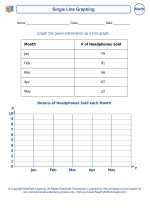
 Worksheet/Answer key
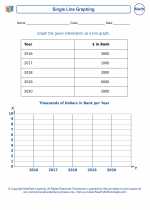
 Worksheet/Answer key
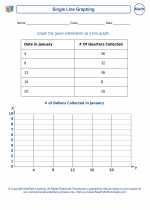
 Worksheet/Answer key
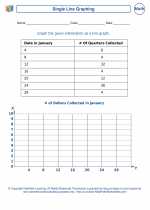
 Worksheet/Answer key
 Worksheet/Answer key