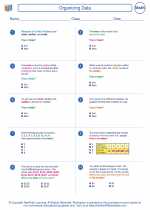
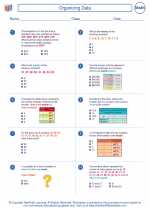
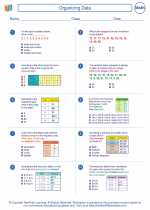
Graphical Representation of Data
Graphical representation of data involves presenting data in the form of graphs or charts. This visual representation helps in understanding the data and identifying patterns, trends, and relationships within the data.
Types of Graphs and Charts
There are several types of graphs and charts used for representing data:
- Bar Graph: A bar graph uses rectangular bars to represent the data. It is used to compare different categories of data.
- Line Graph: A line graph shows the relationship between two variables. It is useful for showing trends over time.
- Pie Chart: A pie chart represents parts of a whole. It is used to show the proportion of each category in the data.
- Histogram: A histogram is similar to a bar graph but is used for representing the distribution of continuous data.
- Scatter Plot: A scatter plot is used to display the relationship between two variables. It is helpful in identifying correlations.
Steps for Creating a Graphical Representation
To create a graphical representation of data, follow these steps:
- Understand the Data: Analyze the data and determine the key variables to be represented.
- Choose the Appropriate Graph: Select the type of graph or chart that best represents the data and the relationships you want to show.
- Label the Axes: Clearly label the x-axis and y-axis with the appropriate variables and units.
- Plot the Data: Plot the data points accurately on the graph or chart.
- Add Titles and Legends: Include a title that summarizes the purpose of the graph and add a legend if needed to explain the data categories.
- Interpret the Graph: Analyze the graph to draw conclusions about the data and communicate your findings.
Study Guide
Here are some key points to remember when studying graphical representation of data:
- Understand the purpose of each type of graph and when to use them.
- Practice creating different types of graphs and charts using sample data sets.
- Learn to interpret graphs and draw conclusions based on the visual representation of data.
- Understand how to label axes, add titles, and create legends for different types of graphs.
- Explore real-world examples where graphical representation of data is used to convey information effectively.
Mastering the skill of graphical representation of data is essential for analyzing and communicating information in various fields such as science, economics, and social sciences.
[Graphical Representation Of Data] Related Worksheets and Study Guides:
.◂Math Worksheets and Study Guides Seventh Grade. Organizing Data
Study Guide Organizing Data
  Worksheet/Answer key
 Organizing Data
  Worksheet/Answer key
 Organizing Data
  Worksheet/Answer key
 Organizing Data

 Worksheet/Answer key
 Worksheet/Answer key
 Worksheet/Answer key

The resources above cover the following skills:
Data Analysis and Probability (NCTM)
Select and use appropriate statistical methods to analyze data.
Find, use, and interpret measures of center and spread, including mean and interquartile range.